


Start the Collector
Run the following command to start the collector.

Note: Replace <PATH TO> with the actual path where the Collector has been downloaded.
Aggregator
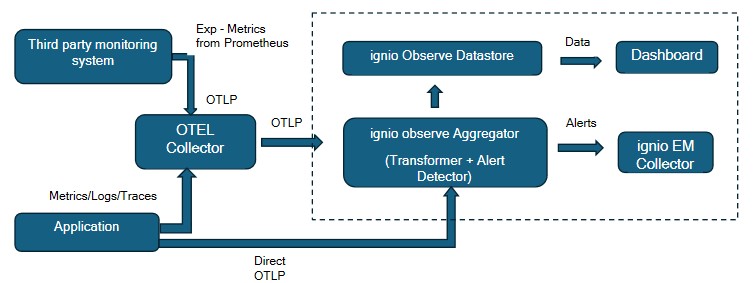
ignio observe aggregator will apply patterns or rules on the logs it receives and only the identified alerts will be stored and visualized in dashboard. All other logs will be dropped at the aggregator itself.
Validate the ignio observe dashboard
Login to ignio with valid credentials and validate the appropriate dashboards.

Open telemetry Metrics collector
Download Open telemetry collector
Download the open telemetry collector based on the operating system and create a dedicated directory on the host and place the downloaded package and create a config.yml which used for monitoring
Configure Receiver
To configure the receiver to collect OS metrics from the system where it is installed make sure the below configuration is present in the config.yml

Configure Processor
Add the below section in the config.yml to add hostname and technology parameters with the data received.

Note: Replace <HOSTNAME> with the actual hostname from where the metrics are to be monitored.
Configure Exporter
To configure the exporter to send data to ignio observe, add the below exporter section in the config.yml.

Note: Replace <AGGREGATOR_HOST:AGGREGATOR_OTEL_LOGS_RECEIVER_PORT> with the aggregator hostname where it is deployed and the respective port.
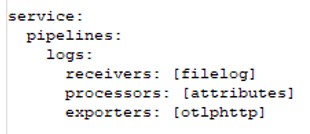
Configure Service Pipeline
Add the below section in the config.yml to enable the component.

Start the Collector
Run the following command to start the collector.

Note: Replace <PATH TO> with the actual path where the Collector has been downloaded.
Aggregator
All the metrics has been processed by aggregator and sent to ignio datastore.
Validate the observe dashboard
Login to ignio with valid credentials and validate the appropriate dashboards.

Open telemetry Metrics collector from Third party monitoring system (Prometheus)
This section explains how we configure the open telemetry collector to send the metrics collected by Prometheus to ignio observe.
Download Open telemetry collector
Download the open telemetry collector based on the operating system and create a dedicated directory on the host and place the downloaded package and create a config.yml which used for monitoring
Configure Receiver
To configure the receiver to collect metrics from the Prometheus server, make sure the below configuration is present in the config.yml

NOTE: Replace < PROMETHEUS_SERVER> and <PORT> with the actual value represent Prometheus server end point.
Configure Processor
Add the below section in the config.yml to add hostname and technology parameters with the data received.

Note: Replace <HOSTNAME> with the actual hostname from where the metrics are to be monitored
Configure Exporter
To configure the exporter to send metrics data to ignio observe, add the below exporter section in the config.yml

Note: Replace <AGGREGATOR_HOST:AGGREGATOR_OTEL_LOGS_RECEIVER_PORT> with the aggregator hostname where it is deployed and the respective port.
Configure Service Pipeline
Add the below section in the config.yml to enable the components defined in receiver, processor and exporter.

Start the Collector
Run the following command to start the collector.
![]()
Note: Replace <PATH TO> with the actual path where the Collector has been downloaded.
Aggregator
All the metrics have been processed by aggregator and sent to ignio datastore.
Validate the Observe dashboard
Leverage out-of-the-box dashboards available for Metrics data or create custom dashboard and for a specific visualization requirement.
Configurations – Direct OTLP
Assumptions
- ignio Observe Aggregator has been installed and configured in customer enterprise to receive telemetry data
- ignio SaaS has been enabled with proper licence
Open telemetry Log/Metrics/Traces for JAVA application
Application must be instrumented to generate the metrics, logs and traces data. Two types of instrumentation are available – one is code-based solution, and another is zero-code solution. Refer OTel instrumentation documents to instrument your application
Please choose the zero-code instrumentation solution to send the logs, metrics, traces for a java application.
Download open telemetry java agent
Download the otel java agent using the below link of opentelemetry site and place it in the folder where application is running.
https://opentelemetry.io/docs/zero-code/java/agent/
Edit the executable file (run.sh/entrypoint.sh)
Edit the executable file by adding the following options:

Note: Replace <PATH TO> with the actual path where the opentelemetry-javaagent has been downloaded. Replace AGGREGATOR HOST and respective PORTS with the actual hostname and port where aggregator is deployed and running in the enterprise.
Restart the application service
Restart the service of the application for changes to reflect.
Aggregator
All the metrics and traces are processed by aggregator and sent to ignio datastore. In case of Logs data, Observe aggregator will apply patterns or rules to the logs and only the identified logs will be stored and visualized in dashboard. All other logs will be dropped at the aggregator itself.
Validate the dashboard
Telemetry data received by Observe aggregator is used in real-time dashboards. Below are few screenshots of such dashboards using Metrics, Logs and Traces.


